


Beyond the glitz and gloss of what may seem like a brilliant ad campaign, there is a need to prove efficiency. After all, if your ad spend isn’t translating to sales and earnings, your campaigns will be a wasted effort. Your ads have to make cents.
That’s where return on ad spend (ROAS) comes in. Calculating ROAS helps determine how effectively your ads are driving profit.
This guide will help you understand how to calculate ROAS and why it matters for ad campaign success.

ROAS measures the revenue generated for every dollar spent on advertising. It helps you see the profitability of your ads and confirm their efficiency.

When measuring ROAS, the standard practice is to express the revenue as a multiple or percentage of the ad cost, such as 3:1, which would mean $3 in revenue for $1 spent.
ROAS is sometimes confused with ROI, but ROAS factors only ad-generated revenue, whereas ROI looks at all ad expenses.
The formula for ROAS is total revenue from ads divided by ad spend. For mobile ad campaigns, the formula is written out like this: ROAS = Ad Revenue / Ad Spend.
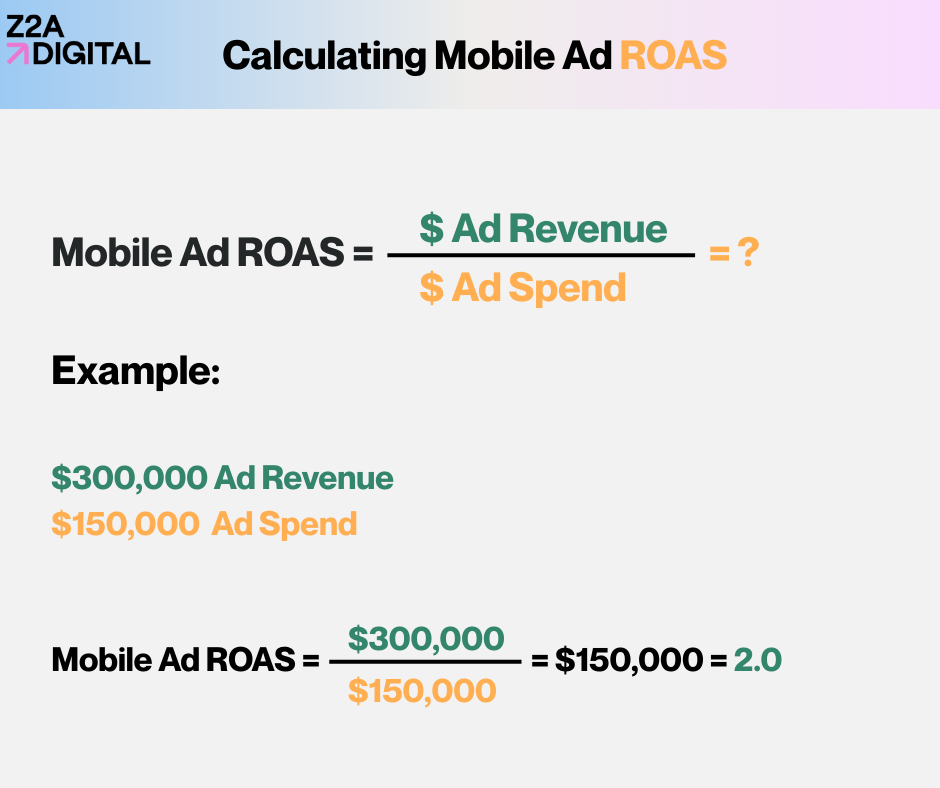
In the example above, this healthcare app company spent $150,000 on their Meta ads campaign, which generated $300,000. So that would suggest they earned $2 for every $1 spent, hence why their ROAS is expressed as 2:1.
However, this is the standard ROAS calculation formula. More advanced variants adjust for margins, because a campaign can have good ROAS on paper but still lose money. This can happen due to:
In the example above, if the healthcare app’s actual revenue is only $1.5 of the $2, then their true ROAS would be 1.5:1, making the campaign less profitable, although still a win for their industry’s given benchmarks (more on this below).
With these factors in mind, it’s wise to use some other formulas.
The first one that comes to mind is margin-adjusted ROAS (mROAS). This formula takes into account the actual “take home” revenue generated by an ad campaign. This is beneficial in circumstances where looking at just the gross revenue would overlook profit losses due to marketplace fees, refunds and more.
The mROAS formula is as follows: mROAS = (Revenue × Gross Margin) / Ad Spend.
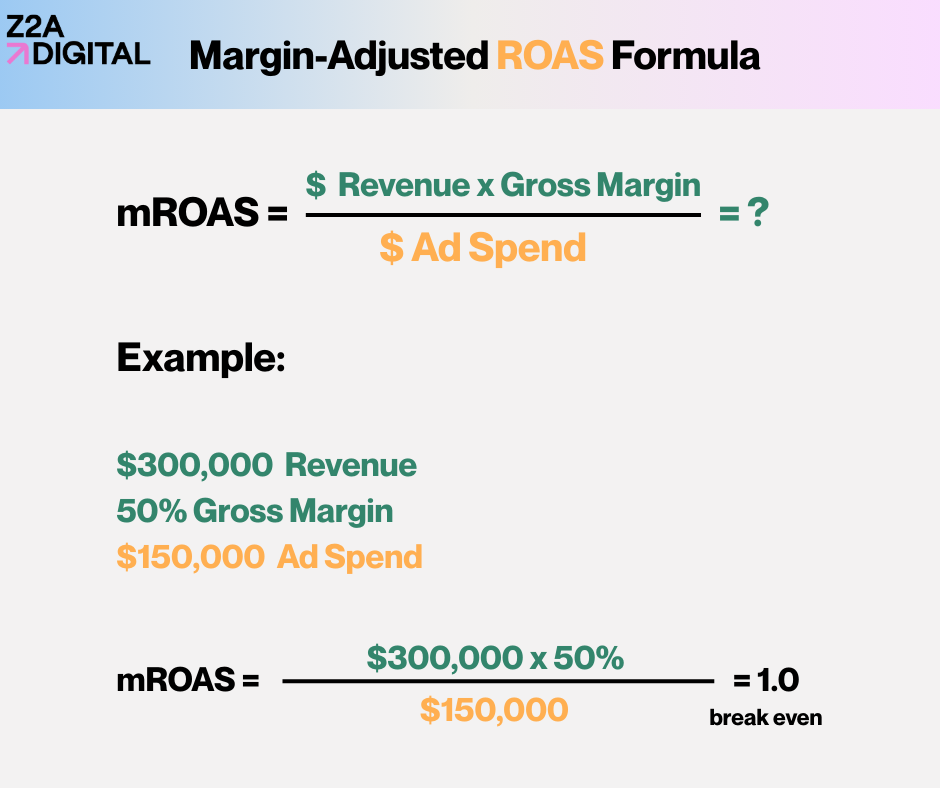
In this case, only 50% of the healthcare app’s revenue is “take home” profit (perhaps, due to marketplace fees, subscription refunds).
Therefore, the campaign only put $150,000 in the app company’s pockets, meaning that there was no profit as the ads merely broke even.
That said, mROAS is not superior to standard ROAS measurements. Providing you are working with fixed pricing and stable margins, the standard ROAS calculation is good enough.
For true efficiency, you can measure for incremental margin-adjusted ROAS. This formula isolates causality (by incorporating incrementality data), helping you see a direct correlation between ad spend and raw, take-home revenue. The formula is as follows: Incremental mROAS = (Incremental Revenue × Gross Margin) / Ad Spend.
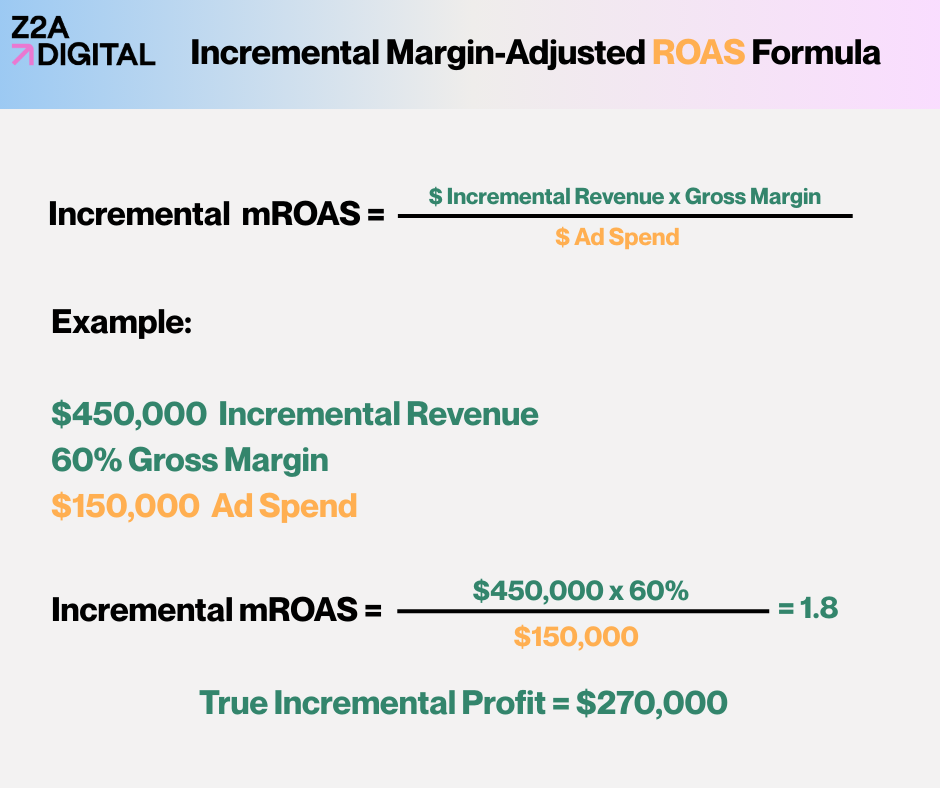
In this case, the healthcare app’s campaign was measured for the number of actual target audience members who made purchases after seeing and clicking the ad campaign. This example demonstrates true take home profit and factors in losses. The incremental margin-adjusted method is a highly effective (and at times the superior) method for determining ad efficiency.
There’s also the contribution ROAS formula, which some teams use to understand when a channel funds its own operations. It looks like this: Contribution ROAS = (Revenue × Contribution Margin) / Ad Spend.
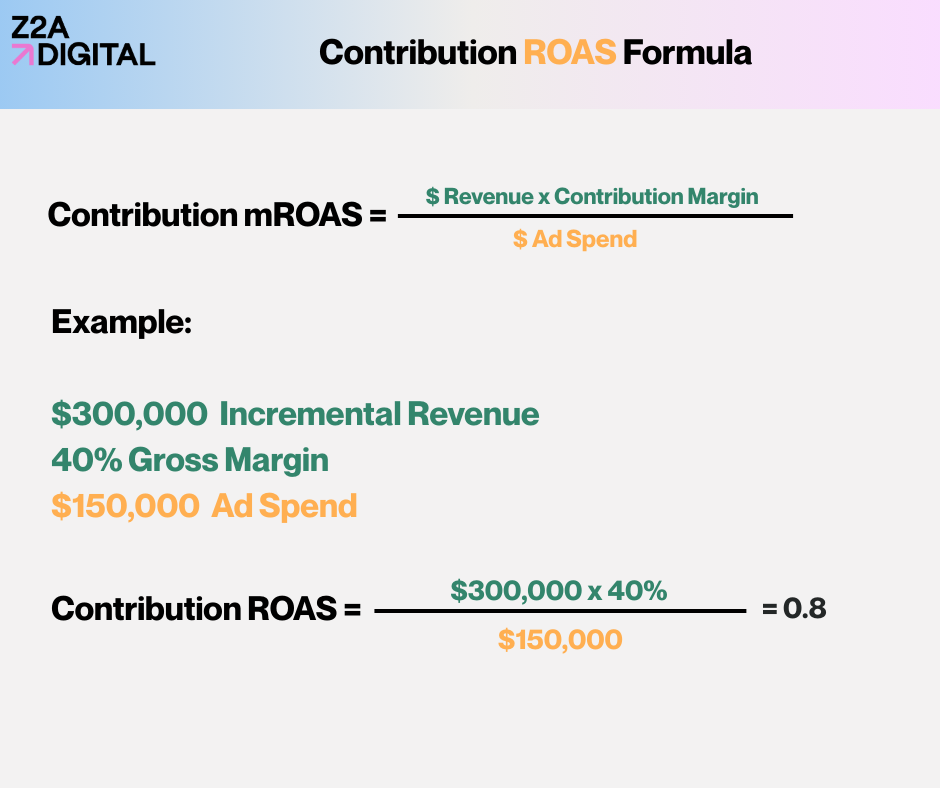
This formula is used when variable costs materially impact unit economics. That said, it isn’t used for standard optimization, only for truth checks when necessary. Given the service-based nature of the healthcare app, contribution ROAS calculations may not be useful.
Knowing how to calculate ROAS matters because it helps you optimize your budget allocation. By highlighting the best-performing ad campaigns across all applicable channels, you can pour more money into them.
The opposite is also true.
By identifying campaigns that don’t perform according to standard, you can pause them and redirect your ad spend into channels that perform better. A strong ROAS signals scalable growth, and makes it clear which channels you should prioritize.
Marketers often ignore corresponding factors such as customer lifetime value (CLTV), fail to include costs that erode revenue (such as those mentioned above), and group channels without segmentation.
Let’s highlight the consequences of each one.
Marketers may ignore LTV leads because they might only see quick sales from a mobile ad campaign and conclude the campaign isn’t working fast enough. They may shut it down prematurely, and miss out on how those users may spend substantially more later via in-app purchases, repeat buys and more. This leads to profit losses, slower business growth, and skewed ROAS.
Forgetting about costs such as platform fees or refunds (which we mentioned above), can create inflated ROAS. The risk here is that an app developer may see the number and reason that it’s time to increase the budget into what could actually be an unprofitable channel. Whether it happens quickly or slowly, margins can erode, potentially leading to emergency pivots or business contractions.
Grouping channels together when analyzing ROAS may create data disparities. For example, a Meta campaign may actually yield a 4:1 ROAS while a TikTok campaign sits at 2:1. But if lumped together, marketers may assume that Meta’s 4:1 ROAS also applies to their TikTok ads. This may lead to the belief that they should pour equal ad spend into both channels, when instead, they should potentially pause the TikTok campaign.

When calculating ROAS, it’s ideal if you:
Here’s a closer look at each one.
Multi-touch attribution tools track all steps a user takes across various devices. For example, they can see if a user watches a mobile ad on Instagram or TikTok, then conducts a Google or ChatGPT search, and installs the app. Tracking these actions prevents undervaluing early awareness ads in mobile campaigns, so you can see the full picture of what’s driving installs and purchases.
When you segment your data by campaign, creative (i.e. video ad vs interstitial), and audience, you can see unexpected drivers of success in your ad campaigns. For example, this tiered segmentation may reveal an ad that boasts 3x ROAS by a Gen Z cohort but underperforms for a Millennial counterpart. Segmenting data lets you see beyond averages, allowing you to focus on ads that perform best (and perhaps expand that channel), while ditching the rest.
Extending your LTV beyond 7 days allows you to capture repeat app spending habits. For example, users may only install an app on day 1 without purchasing anything, but they might spend $50 or more over the next 30 days. A short window (under 7 days) would miss that pattern. Establishing a broader window brings the whole purchase cycle into focus so you can avoid making decisions such as premature budget cuts based on narrow sales data.
Automating your ROAS calculation allows you to pull real-time data, while eliminating manual errors. Also, refund edits can catch chargebacks that chip away revenue. The right platform also incorporates margin benchmarking (the mROAS mentioned earlier) to account for costs that typical ROAS modelling ignores.
Piggybacking off that last point, it’s important to know when to look beyond typical ROAS formulas.
For instance, you should use the mROAS if your app products or services have varying profit margins since it factors the cost of goods (COGS) to demonstrate true profitability.
But you’ll want to apply the incremental margin-adjusted ROAS formula for scenarios measuring additional revenue from scaled ad spend such as testing bid increases. This would isolate marginal gains to verify if extra dollars truly add profit without eating into your organic sales.
The ideal ROAS varies among industries, although a common range is the 2:1-4:1. That said, each sector has an ideal range. Here's a look at some industry standards for ROAS.
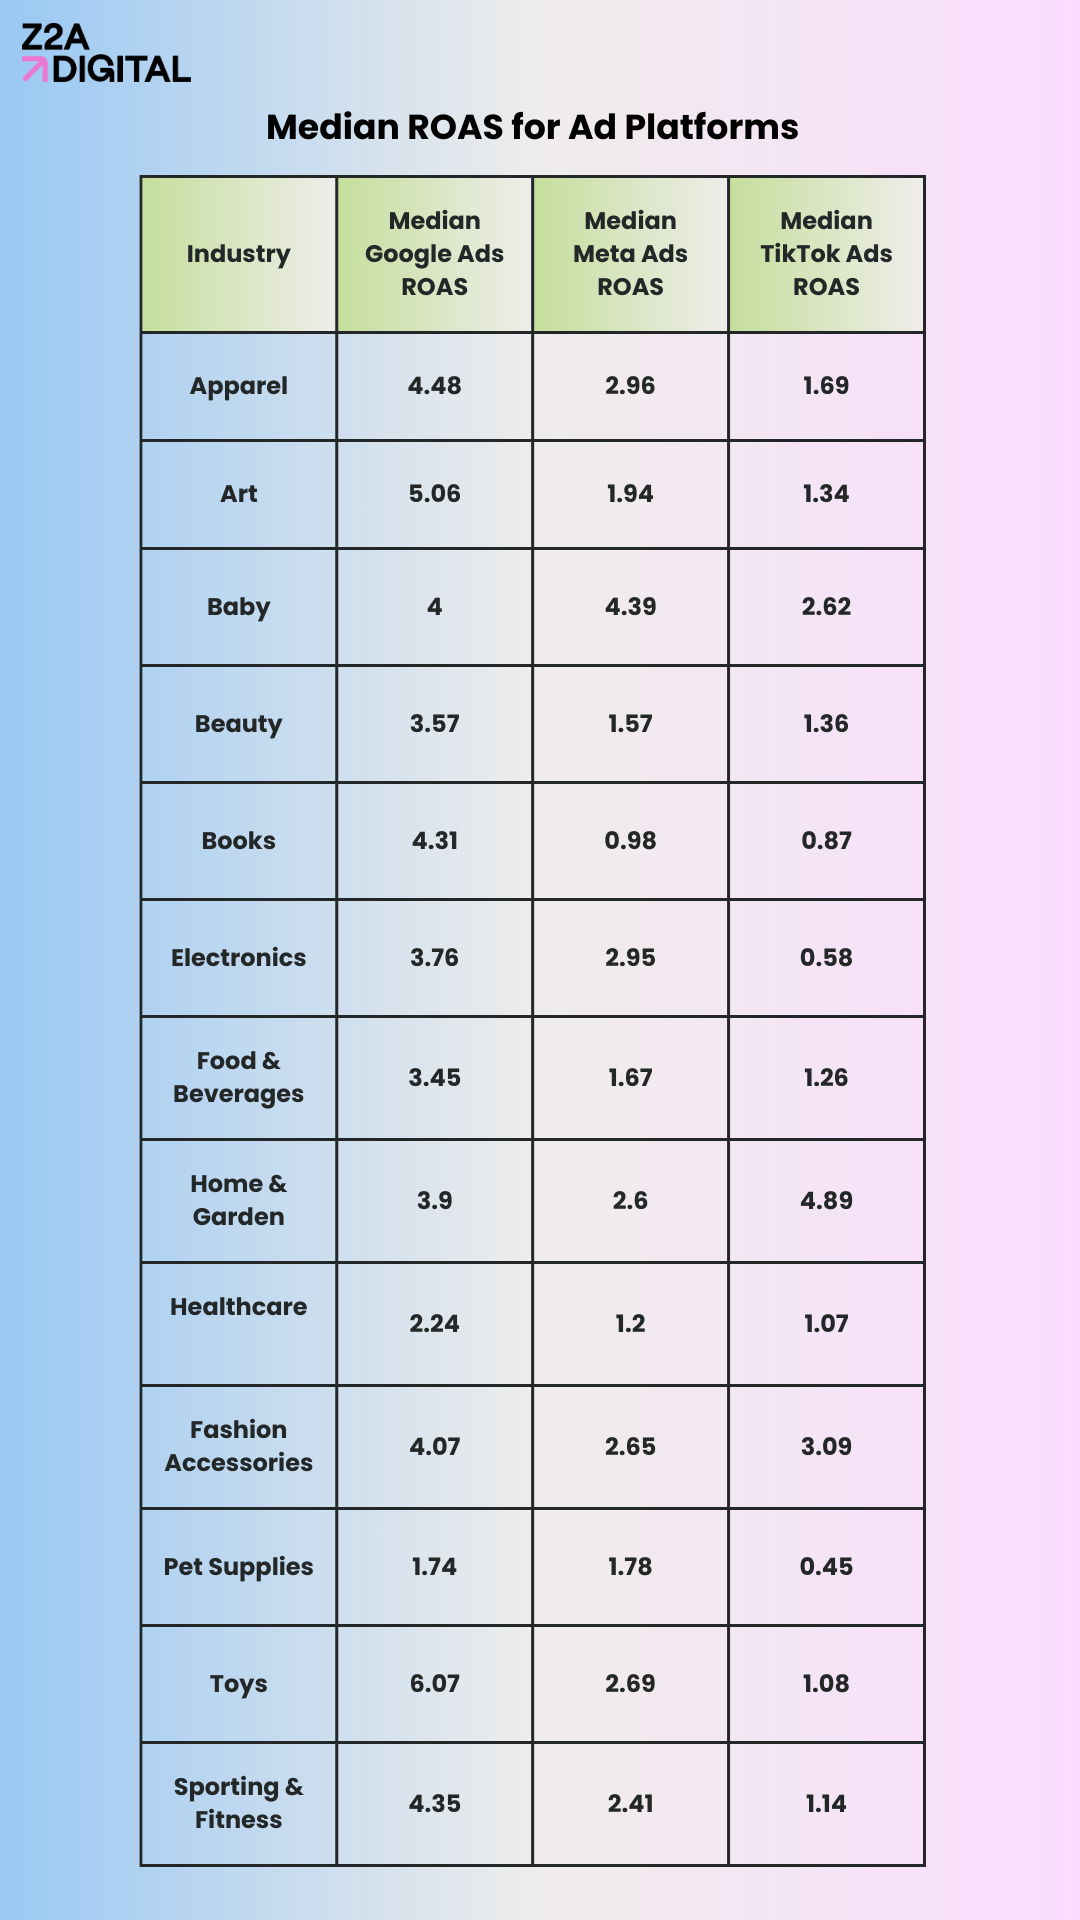
Source: Segwise AI
As you can see, some ad platforms naturally have higher ROAS, such as Google Ads, which typically generates higher numbers than Meta. It’s important to keep in mind that not all campaigns need high ROAS. Brand awareness campaigns are not conversion-driven, so it’s acceptable if top-of-the-funnel ads yield lower returns.
Learning how to calculate ROAS for an ad campaign is straightforward, and doesn’t require significant resources to do so. The formulas (and calculators) will get you up to speed for a quick analysis of your ROAS. Just make sure to apply the best practices mentioned above, and keep in mind that industry and ad platforms can skew your ideal ROAS to a higher or lower ratio. And don’t hesitate to contact a user acquisition agency if you need additional guidance and support to make sense of your campaign metrics. They can help you see blind spots you may overlook when analyzing your data.
If you’re looking to support your ROAS calculation and ad optimization, get in touch with us to learn how we can help you scale your app growth.
Across multiple industries, a good ROAS is 2:1-4:1. However, factors such as profit margins, operating costs, and industry benchmarks can influence this, meaning there is no universally “right” answer.
The formula of ROAS is total ad revenue / ad spend. This is the primary formula used for calculating ROAS under typical circumstances. That said, there are other formula variants to calculate margin-adjusted ROAS (to account for margin costs), and incremental margin-adjusted ROAS to account for incrementality factors.
ROI measures the performance of an investment to quantify how much revenue the investment generated. ROAS, however, measures how much revenue a company earns for the money they spent on advertising.

.png)


.webp)
.png)
.png)